An introduction to SPSS
In this short practical we will make sure we can all load SPSS, and we will load some data and take a look at the main features of the interface.
Brief background
SPSS is a widely used statistical software package that allows you to do data processing/editing, data visualisation (i.e. graphs/charts), and carry out a very wide range of data analysis. In these sessions we’ll see how to do all of these things. In SPSS, like most software programs you’ve probably used, you can tell the program what you want to do via different tools accessed through menus and “clicking buttons”. However, you can also tell SPSS what you want it to do via code, or as SPSS calls it “syntax”, i.e. by typing in commands as words and numbers. See the additional information for more details on SPSS and related software.
The datasets
Before we go further a brief word about the datasets we will be using in these SPSS practical sessions.
The datasets that we’ll be using in these data analysis sessions are a mix of simulated (i.e. artificially generated) and real data. The main dataset that we will be using for most analyses is the SBP final data.sav dataset, which is an SPSS format dataset as indicated by the “.sav” suffix. We will be using a more basic Excel version of this dataset and the SPSS format version of this dataset for the first few exercises.
The SBP final data is a simulated dataset but it is designed to be representative of a typical cross-sectional dataset of individual-level data. Although the dataset is simulated it is designed to be realistic and includes typical features like missing data. For simplicity we will therefore talk about the dataset as if it was a real dataset from now on, but be aware that it is somewhat simplified with fewer variables than we would likely collect for such a study. Specifically, the dataset contains data collected from a survey investigating what biological, health and socio-economic factors influenced individuals’ blood pressure and hypertension status. The dataset was collected from a study using a simple random survey of individuals aged 18 or over (the only eligibility criteria) who lived in a single city, and the data were collected at approximately the same point in time (e.g. over the course of a few weeks). The dataset contains data from 556 participants. Therefore, the “unit of observation” in this dataset is the individual.
Note: we do not imply any social/political judgments based on how we have coded certain variables in this dataset.
Practice
Exercise 1: loading SPSS
Please note that all video-based SPSS instructions were made with SPSS version 27, so they may look a little different to the more recent version (29) you will be using, but the instructions should all work.
Opening SPSS
If you happen to already have a copy of SPSS installed on your laptop feel free to use that. However, you can access the latest version of SPSS either from the campus computers that are available in the computer rooms where we will hold all the practical sessions, or from your personal laptop if you’d prefer. In both cases you can access SPSS via the online “appsanywhere” software platform, that allows you to access all kinds of software for free.
Below you can read about how to run SPSS from either a campus computer or your own laptop via the appsanywhere platform.
Campus computers
Open the Google Chrome internet browser and navigate to https://appsanywhere.leeds.ac.uk/. You may have to login: if so use your usual university username but remember to add ‘@leeds.ac.uk’ at the end of your username. You should see a blue popup message appear at the bottom right of the screen saying “Validation in progress…”. The AppsAnywhere “Cloudpaging Player” app will also launch while this happens. This needs to be running for you to access software via the appsanywhere platform.
After a few seconds you should then see a second popup message appear saying “Validation Successful”. If you see a message saying “Validation failed” click the “Retry” button, but if you see the same message again see the second bullet point below for help. Otherwise, you can then click on the search field at the top of the https://appsanywhere.leeds.ac.uk/ page and enter “SPSS”. Look for “SPSS Statistics 29” and click the “Launch” button, which will load SPSS after a while. This can take a little time as it may need to install some files on the computer.
Once you have run SPSS from a computer it should be available directly from the Cloudpaging Player app, so next time try just running the app from the start menu, highlighting SPSS in the list of “Applications” and clicking the “Launch” button. If you can’t see SPSS you’ll have to go via the appsanywhere.leeds.ac.uk site again though.
If you saw a message saying “Validation failed” even after retrying then the app probably isn’t installed. You can check by looking whether the app is in the Windows Start menu. Just click on the Widows button in the bottom left corner of your desktop and type “cloud”. If the Cloudpaging Player app icon and name doesn’t appear it’s not installed. IT say you have to contact them to get it installed, so if it’s not installed please try other computers until you find one where the app is installed.
Personal laptops
Windows-based laptops
You will need to install the Cloudpaging Player app to access software from the AppsAnywhere platform if you haven’t previously done this. Please follow the instructions on the IT help page here. It shouldn’t take too long, but may take 5-10 minutes. Once you have installed the app go to the Appsanywhere website at https://appsanywhere.leeds.ac.uk/. A purple spinning icon should appear in the bottom right corner of your screen while the Cloudpaging Player loads and validates that you have access to the software on the website. This should change to a green tick icon fairly quickly. You can then enter “SPSS” in the search box on the webpage. Look for “SPSS Statistics 29” and click the “Launch” button, which should load SPSS after a while.
Note that once you’ve run SPSS from your laptop once it should be available directly from the Cloudpaging Player app. So next time try just running the app from the start menu/desktop shortcut, highlighting SPSS in the list of “Applications” and clicking the “Launch” button. Although if you can’t see SPSS you’ll have to go via the appsanywhere.leeds.ac.uk site again though.
Any problems let us know, but please be aware we are not IT we are just academics! Therefore, if we can’t solve the problem quickly we recommend moving onto a campus computer, as they should have no issues running SPSS. You can always speak to IT later about trying to get access to SPSS via your personal laptop for the later sessions if that’s really important to you.
Macs
If you have a Mac then unfortunately you cannot run AppsAnywhere directly and you must access it via the university’s Virtual Windows Desktop. You will first have to install the Virtual Windows Desktop app. To do this follow the instructions here.
Once you’ve installed the Windows Virtual Desktop app run the “Remote Desktop” app. You will have to sign in using your university ID. Remember to include @leeds.ac.uk at the end of your username. Then in the window that appears double click on the “WVD - Academic” icon.
Once the virtual Windows desktop appears open Google Chrome internet browser and go to the Appsanywhere website at https://appsanywhere.leeds.ac.uk/. A purple spinning icon should appear in the bottom right corner of your screen while the Cloudpaging Player loads and validates that you have access to the software on the website. This should change to a green tick icon fairly quickly. You can then enter “SPSS” in the search box on the webpage. Look for “SPSS Statistics 29” and click the “Launch” button, which should load SPSS after a while.
Note that once you’ve run SPSS from your laptop once it should be available directly from the Cloudpaging Player app. So next time try just running the app from the start menu/desktop shortcut, highlighting SPSS in the list of “Applications” and clicking the “Launch” button. Although if you can’t see SPSS you’ll have to go via the appsanywhere.leeds.ac.uk site again though.
Any problems let us know, but please be aware we are not IT we are just academics! Therefore, if we can’t solve the problem quickly we recommend moving onto a campus computer, as they should have no issues running SPSS. You can always speak to IT later about trying to get access to SPSS via your personal laptop for the later sessions if that’s really important to you.
Exercise 2: loading data and understanding the key features of the interface
- First load SPSS, then follow the instructions below to practice loading a dataset and understanding the layout and key features of SPSS.
Video instructions: loading data, and understanding the key features of interface
Written instructions: opening SPSS, loading data, and understanding the key features of interface
Read/hide
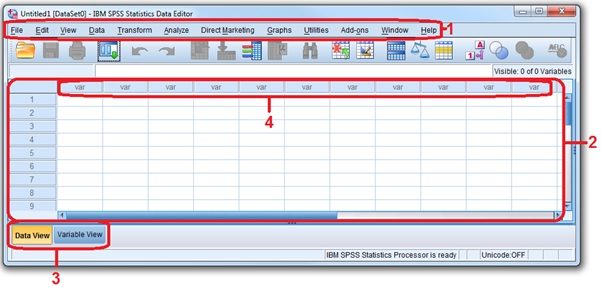
- When you load SPSS unless it is an older version you will get two windows appear. The upper one has “Welcome to SPSS” in the top left corner. Just close this window leaving open the “data editor” window, which will say “Untitled…” in the top left corner, and which looks like this:
- SPSS has two main windows: the data editor, as we’ve just seen in the image above, and the “output window”, which displays the SPSS syntax or code that the buttons you click create to tell SPSS what to do (which you can ignore and you’ll probably find annoying that it’s displayed every time you do something) along with the results of those commands (usually printing tables of results from analyses and producing graphs, which are useful). This only appears once you tell SPSS to do something though. For simplicity we will just refer to the data editor window as the main window from now on.
Loading data in SPSS
Next let’s load some data so we can explore the main window (and the output window will appear for the first time). Go back to the main window in SPSS and in the main menu click File > Open > Data. Then in the Open Data tool window that opens navigate to the folder where you saved the “MSc & MPH statistics computer sessions practical files.zip” folders and go into the “Datasets” folder in the same way you would locate a folder in Windows Explorer. Find the file called “Example basic data.sav” and either double click on it or click on it once and then click the OK button.
This is an SPSS format dataset (.sav) and therefore contains more data and formatting of the data than other formats such an Excel (.xlsx) or .csv etc. This allows it to store things like variable labels and value codes (see below).
You will eventually see the output window appear and display some code that is telling SPSS to load the dataset, and then SPSS should take you back to the main window where you will see the raw values of the data in the Data View tab. See number 3 in the image above. The variable names are in the top row and the raw data values are in the cells. You will see there are three variables.
The main features of the main window
Refer to the “SPSS main window view” image above and the numbered features:
The main menu. This is where you select commands to do most things you need to do.
The raw data view. Similar to Excel, here you will see the raw data displayed (although you can choose whether to display categorical variables’ labels or raw values if numerically coded - see below).
These tabs allow you to either view the Data View, where the raw data is displayed in the main area (2), or the Variable View, where information about each variable is displayed and where you can edit variables’ characteristics.
Variable names will be displayed here once any data are loaded.
Variable names/labels
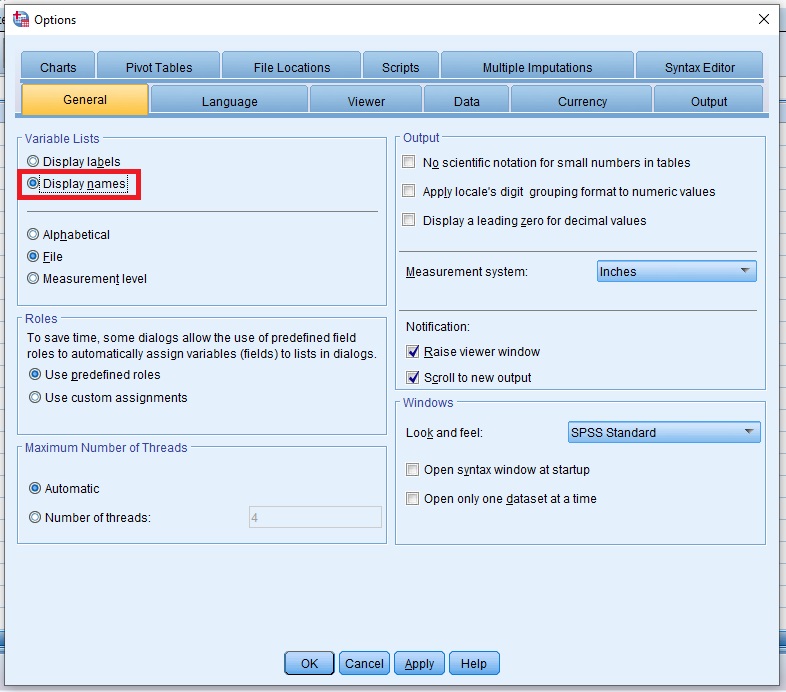
Before going further we will just set an option (or check that it’s already set) in SPSS so that it displays variables’ names rather than variables’ labels in the various tools we will be using. We will see what the difference between these two things are later. This is because in the instructions below we refer to variables’ names rather than their labels. However, you can certainly choose to display either for your own analyses.
- From the main menu bar go: Edit > Options and then under the General look under the Variable Lists section and select the Display names option as shown below:
The Variable View and variable properties
Now that we’ve loaded some example data into SPSS let’s look at the variable properties we can edit in the Variable View tab in the main window.
Name = the variable’s name. Like a file name, this should be short and descriptive and clear.
Type = the “type” of format in which the variable is stored, e.g. numbers, string (letters and possibly numbers and/or characters) etc. Note this is just how the variable is stored, and not the type of variable in terms of categorical, numerical etc (see “Measure” below). You can often just ignore this and you should not alter this unless you know what you are doing!
Width = for string variables, width refers to how many characters a value can hold. Again you can just ignore this and should not alter this unless you know what you are doing!
Decimals = how many decimal places will be displayed (note: changing this does not alter how many decimal places a value actually has stored though).
Label = the descriptive label of the variable, used to briefly describe what the variable measures in more detail than the variable name.
Values = used to create or edit value labels, i.e. labels attached to different numerical values. We’ll come back to this shortly.
Missing = used to set or change which specific values (if any) represent different types of missing data. We will not be using this.
Columns = how wide the displayed columns are currently.
Align = whether values are left or right aligned.
Measure = what type of data are stored in each variable. In the terminology we’ve been using: nominal = a binary variable or a categorical variable with 3 or more category levels, ordinal = an ordinal categorical variable, and scale = a discrete or continuous numerical variable.
Role = I’m not actually sure what this does so presumably it’s not anything that important and you can ignore it. Google if interested!